Wednesday, May 16, 2012

West Boulder Market is HOT! Spring 2012 Sales Data Encouraging

The weather heated up early this year in Boulder and so did the real estate market in my home neighborhood -- the greater Flatirons area (University Hill, Rose Hill, Chautauqua). Spring sales show that the pent-up demand we’ve been hearing about during the recession is becoming “un-pent.” See table below for 2012 sales through mid-May. Confidence has returned and motivated buyers are coming out of the woodwork – from CU parents to investors and homebuyers. The problem is that there are not enough quality homes on the market for them to buy. In mid-May there were 43 active listings under $2 million in this area, of which 19 were already under contract!
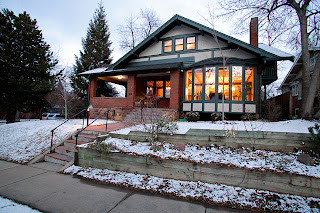
SOLD! My listing at 990 Lincoln Place went under contract in two weeks.
Chautauqua, Rose Hill - West of 9th, South of Canyon
Closed
Address
List Price
Sold Price
Discount
Beds
Bath
Gar.
DOM
Total SF
$/ SF
Fin. SF
$/fin
3/30/12
474 Marine
$499,000
$450,000
9.82%
2
2
1
79
1,740
$259
1,200
$375
4/18/12
924 8th
$525,000
$485,000
7.62%
2
2
1
170
1,121
$433
1,121
$433
4/6/12
623 Marine
$585,000
$551,400
5.74%
3
3
2
81
2,592
$213
2,592
$213
4/23/12
834 7th
$599,000
$599,500
-0.08%
2
2
2
46
1,679
$357
1,492
$402
1/3/12
627 Marine
$674,900
$640,000
5.17%
3
2
2
100
2,110
$303
1,724
$371
1/31/12
835 Grant
$849,000
$774,553
8.77%
4
3
0
185
3,284
$236
3,100
$250
3/20/12
470 College
$1,295,000
$1,220,000
5.79%
5
3
0
75
2,916
$418
2,750
$444
3/30/12
445 Christmas Tr.
AUCTION
$1,650,000
0.00%
4
4
2
51
5,804
$284
5,804
$284
3/30/12
900 6th
$1,975,000
$1,980,000
-0.25%
4
3
2
54
3,360
$589
3,360
$589

AVERAGES
$875,238
$927,828
4.73%
3
3
1
93
2,734
$344
2,571
$373


The Hill - East of 9th, between Canyon and Baseline
5/3/12
965 10th
$405,000
$385,000
4.94%
3
2
1
109
1,406
$274
1,406
$274
2/17/12
896 17th
$499,900
$485,000
2.98%
3
2
0
19
1,849
$262
1,849
$262
5/11/12
833 Lincoln
$549,000
$550,000
-0.18%
3
2
1
32
1,508
$365
1,248
$441
4/12/12
1260 Cascade
$589,900
$565,000
4.22%
3
2
2
58
1,359
$416
1,359
$416
1/26/12
1315 9th
$575,000
$575,000
0.00%
4
2
2
12
1,824
$315
1,824
$315
3/30/12
932 Marine
$639,000
$600,000
6.10%
5
4
0
43
2,172
$276
2,172
$276
4/24/12
811 15th
$750,000
$720,000
4.00%
3
2
2
76
2,058
$350
1,966
$366
2/29/12
1035 10th
$799,000
$725,000
9.26%
6
4
4
93
3,043
$238
3,043
$238
3/30/12
990 Lincoln
$799,000
$764,000
4.38%
4
2
0
15
3,335
$229
2,389
$320
3/29/12
1026 Lincoln
$835,000
$800,000
4.19%
4
3
0
242
2,841
$282
2,561
$312
3/28/12
904 15th
$839,000
$820,000
2.26%
5
4
2
109
2,712
$302
2,642
$310
2/29/12
1139 12th
$868,400
$825,000
5.00%
7
4
0
365
3,898
$212
2,660
$310
4/26/12
766 16th
$995,000
$950,000
4.52%
4
4
3
107
3,402
$279
3,402
$279
3/29/12
842 13th
$1,195,000
$1,100,000
7.95%
3
3
3
312
2,620
$420
2,620
$420

AVERAGES
$738,443
$704,571
4.26%
4
3
1
114
2,431
$301
2,224
$324
Discount = Percentage off of list price; DOM = Days on the Market;  /SF = Price per square foot (total) $/fin = Price per finished square foot
Source: IRES MLS. Information deemed reliable, but not guaranteed.

Tuesday, November 8, 2011

Homes Are Selling on the Hill! University Place Market Report

Homes are selling on the Hill! I've compared a list of single-family home sales for 2011 through October 31, 2011, in the University Place subdivision (my home neighborhood).

Compared with the same period of time last year, we see an increase in sales activity -- more homes sold this year (21 versus 17 last year) for closer to list price (3.9% discount versus 4.9% discount last year). However, both average sales price and price per square foot declined slightly this year, from $741,000 to $723,000 and from $268 to $257, respectively.

If you're curious about what your home is worth, please contact me for a custom market analysis. No fee and no obligation. Here are the stats on sales so far this year:

Saturday, August 13, 2011

So, You Want to Be a Landlord? Investment Properties in Boulder


Whether you're thinking of renting out your home temporarily or if you're considering investing in rentals in the City of Boulder there are a number of quirky regulations you should know about.
  • A Rental License is REQUIRED. Unless you meet specific circumstances, like roommate situations or short-term, temporary rentals of your primary residence, you are required to apply for a rental license.
  • A new program called SmartRegs requires landlords to make certain energy efficiency updates to their properties by January of 2019. These can mean significant costs, so do the math before you buy.
  • Occupancy limits are enforced. In most zoning districts, a family plus two other people or a total of three unrelated people can live together in a single-family house. If your property is an apartment, condo or townhouse, the city regulations generally allow occupancy of a family plus two other people or four unrelated people. Properties such as legal non-conforming units, group homes, rooming houses, fraternities and sororities have specific occupancies for each building.
The City also has some handy resources for landlords and tenants:
  • The Landlord-Tenant Handbook spells out the responsibilties of both sides.
  • The City of Boulder has endorsed the "Boulder Model Lease" which is recommended but not mandatory. Copies of the model lease are available from the Community Mediation Service, 2160 Spruce Street, Boulder, Colorado, 80302 or on the link above.
As a landlord for five years and a property manager for two years prior, I know from personal experience that being a landlord is not always fun. But by putting some time in on the front end, you can avoid a lot of hassles and costs later on. I highly recommend careful screening of tenant prospects, including credit checks.

It's also a good idea to put together a list of repair people you trust -- a handyman, electrician, plumber, HVAC repair, pest control contractor -- BEFORE you need them. That way, you're not scrambling when your tenant calls in February to say their furnace isn't working.

Contact me at monique@moniquecole.com if you would like a few names of my trusted vendors or if you have any other questions about being a landlord in Boulder.

Friday, February 11, 2011

New MLS Fields Help Sell Green Features

Boulder is a great market for green-built homes. But just saying your home is green does not make it so. Proper marketing that highlights quantifiable and verifiable features pays off in terms of how fast your home sells and for how much money.


The good news is that the Boulder area MLS system – IRES – has added searchable fields and a green addendum that makes marketing your home easier. The key is to find a Realtor who understands the green features of your home, and knows how to communicate the benefits to buyers and their brokers.


If you have any questions, or if you’d like a free market analysis of your home, please contact me at 303-473-2773 or monique@moniquecole.com.


New IRES MLS Green Features

Our MLS system is the first in the state to institute searchable fields for these features:

- HERS rating

- ENERGY STAR Qualified New Home

- LEED for Homes

- NAHB/NGBS-ICC 700

- Solar PV

- Solar Thermal

- Green Features Addendum (includes construction type, Heating, Cooling and Ventilation systems, water efficiency, indoor air quality sustainable materials, energy features [i.e. windows, passive solar, roof, thermostat], energy star appliance)


Prepare Your Home for Market

- Gather your paperwork – warranties, Energy Star ratings of appliances, solar system specifications, etc.

- Get a HERS rating

- If applicable, apply for 3rd party certification through LEED for Homes, Energy Star or NAHB

- Ask your Realtor for a Green Features Addendum Form and fill it out, along with your Seller’s Property Disclosure


The Value of MLS Green Features

A study in the Northwest by the Master Building Association of King & Snohomish Counties looked at the relationship between marketing comments in MLS mentioning Built Green, LEED for homes, or Energy Star certification with sales price.

Study: 1,470 certified homes sold 2007-April 2009.

Results:

- Certified homes sold for a 14% premium (Average $534,000 versus $458,000 for non-certified)

- All counties reported a premium, with Thurston County the highest at 25% premium

- Built Green was the most often referenced certification


Bottom Line Value:

A market study by the Earth Advantage Institute published in 2009 compared homes in two different Northwest markets – those certified by Energy Star, LEED for Homes, Built Green and Earth Advantage versus comparable homes with no distinguishing green features that sold during the same period. Here are the results:

Portland, Oregon:

Study: 92 homes certified by 3rd parties versus 340 non-certified homes built between 2002 and 2008, and SOLD between 2006 and 2008.

Green Certified Homes:

- Sold 18 days faster

- Sold for 4.2% more $$$ (Average: $431,900 versus $390,400 for non-certified)

- Sales price per square foot: $223 versus $196 for non-certified

Seattle, Washington

Study: 62 certified homes versus 207 non-certified comparable homes built between 2002 and 2008 and SOLD between 2006 and 2007

Results – Certified Homes:

- Sold for 9.6% more (Average $487,000 versus $470,000 for non-certified)

- Cost per square foot $278 versus $202 for non-certified


Tuesday, January 4, 2011

15% for Nonprofits, continuing into 2011!

In the spirit of the season, I have decided to extend my 15% for charity program into 2011. This year, I donated 15% of my commissions to the non-profit choice of each client -- from ArtLink of Longmont to the national Leukemia and Lymphoma Society. Rest assured, you will still get 100% of my high-quality service as a home buyer or seller. Wishing you and your loved ones Happy Holidays! For more details on the program and my favorite non-profits, go here: 15% for Nonprofits

Monday, August 30, 2010

Prices up, sales down -- what gives?

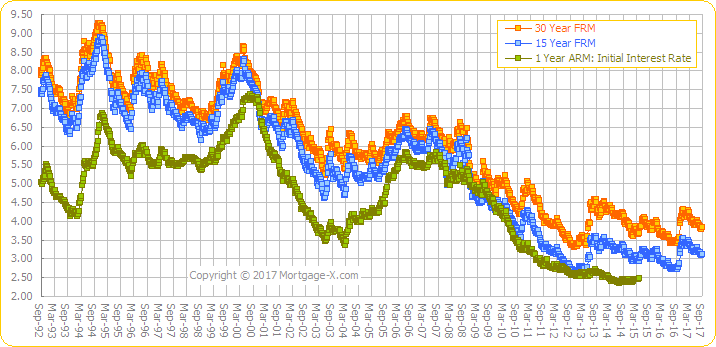
Not surprisingly, sales of existing homes took a dive in July after the expiration of the home buyer tax credit. But home prices continued to rise, if only slightly. The reason is that interest rates for a 30-year fixed mortgage have never been lower, meaning that buyers can afford more expensive homes.

In the Western region, sales fell 25% in July, but the median price rose 3.3%, compared with July of 2009 to $224,800. Statistics for Boulder showed a more sluggish market. Volume of single family home sales in July fell almost 29% compared to July of 2009 and the median home price rose less than 1% to $524,500.

Lawrence Yun, NAR chief economist, said a soft sales pace likely will continue for a few additional months. “Consumers rationally jumped into the market before the deadline for the home buyer tax credit expired. Since May, after the deadline, contract signings have been notably lower and a pause period for home sales is likely to last through September,” he said. “However, given the rock-bottom mortgage interest rates and historically high housing affordability conditions, the pace of a sales recovery could pick up quickly, provided the economy consistently adds jobs.

Interest rates for a 30-year mortgage have never been lower. Last week, Freddie Mac reported the 30-year fixed was down to 4.42 percent. To understand just how significantly low these rates are, look at the orange line on this chart (in the 1980s, rates climbed up into the teens).


Reproduced with the permission of Mortgage-X.com