Showing posts with label market statistics. Show all posts

Monday, February 2, 2015

It's a Seller's Market on the Hill!

University Hill, Boulder, Real Estate Market Snapshot

There’s good news all around for the real estate market in Boulder’s University Hill neighborhood as we roll into 2015 ... unless you are a buyer trying to find a home here.  I can’t remember a time when it was more of a seller’s market.

Last year, there was a significant drop in the number of homes sold in the neighborhood – only 22 homes sold compared with 33 in 2013. Meanwhile, the median sales price increased by 13% to $871,000, and homes sold very close to their list price. Sales prices ranged from just under $480,000 for a tiny two-bedroom house on 18th St near Baseline to over $1.6 million for a historic Tudor on the corner of 11th and Cascade Avenue that had been on and off the market since 2012.

In terms of low inventory and climbing home values, the Hill is trending in the same direction as Boulder, only steeper. Last year, Boulder saw a 13% decline in the number of homes sold and an 8% increase in median sales price.

2015 promises even more price increases as we have high buyer demand and a low inventory of homes for sale. You may see and hear about new developments in Boulder, but most of them are rental apartments and commercial projects with very little in the way of new homes for sale.  Thankfully, there are new home developments in outlying areas like Lafayette, Longmont and Superior adding inventory. But I predict the housing shortage will not ease in Boulder anytime soon.

If it’s such a seller’s market, you might ask, then why aren’t more people selling? The simple answer is that they don’t want to be left homeless. Unless they are moving out of the area, home sellers face the same challenges as other buyers as they try to find a replacement home. Rest assured that I have developed some unique strategies to help get buyers into homes. Feel free to contact me with any questions or for a free market analysis of your home!

University Hill Home Sales
2013
2014
% change
# of homes sold
33
22
-33%
Median $ per sq ft
$323
$323
0%
Median sales price
$767,500
$871,000
13%
Discount off of list price
-3.04%
-2.46%
-19%
Average days on market
60.50
68.00
12%

2014 Home Sales on University Hill

Wednesday, May 16, 2012

West Boulder Market is HOT! Spring 2012 Sales Data Encouraging

The weather heated up early this year in Boulder and so did the real estate market in my home neighborhood -- the greater Flatirons area (University Hill, Rose Hill, Chautauqua). Spring sales show that the pent-up demand we’ve been hearing about during the recession is becoming “un-pent.” See table below for 2012 sales through mid-May. Confidence has returned and motivated buyers are coming out of the woodwork – from CU parents to investors and homebuyers. The problem is that there are not enough quality homes on the market for them to buy. In mid-May there were 43 active listings under $2 million in this area, of which 19 were already under contract!
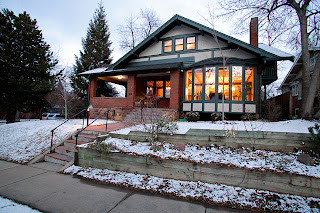
SOLD! My listing at 990 Lincoln Place went under contract in two weeks.
Chautauqua, Rose Hill - West of 9th, South of Canyon
Closed
Address
List Price
Sold Price
Discount
Beds
Bath
Gar.
DOM
Total SF
$/ SF
Fin. SF
$/fin
3/30/12
474 Marine
$499,000
$450,000
9.82%
2
2
1
79
1,740
$259
1,200
$375
4/18/12
924 8th
$525,000
$485,000
7.62%
2
2
1
170
1,121
$433
1,121
$433
4/6/12
623 Marine
$585,000
$551,400
5.74%
3
3
2
81
2,592
$213
2,592
$213
4/23/12
834 7th
$599,000
$599,500
-0.08%
2
2
2
46
1,679
$357
1,492
$402
1/3/12
627 Marine
$674,900
$640,000
5.17%
3
2
2
100
2,110
$303
1,724
$371
1/31/12
835 Grant
$849,000
$774,553
8.77%
4
3
0
185
3,284
$236
3,100
$250
3/20/12
470 College
$1,295,000
$1,220,000
5.79%
5
3
0
75
2,916
$418
2,750
$444
3/30/12
445 Christmas Tr.
AUCTION
$1,650,000
0.00%
4
4
2
51
5,804
$284
5,804
$284
3/30/12
900 6th
$1,975,000
$1,980,000
-0.25%
4
3
2
54
3,360
$589
3,360
$589

AVERAGES
$875,238
$927,828
4.73%
3
3
1
93
2,734
$344
2,571
$373


The Hill - East of 9th, between Canyon and Baseline
5/3/12
965 10th
$405,000
$385,000
4.94%
3
2
1
109
1,406
$274
1,406
$274
2/17/12
896 17th
$499,900
$485,000
2.98%
3
2
0
19
1,849
$262
1,849
$262
5/11/12
833 Lincoln
$549,000
$550,000
-0.18%
3
2
1
32
1,508
$365
1,248
$441
4/12/12
1260 Cascade
$589,900
$565,000
4.22%
3
2
2
58
1,359
$416
1,359
$416
1/26/12
1315 9th
$575,000
$575,000
0.00%
4
2
2
12
1,824
$315
1,824
$315
3/30/12
932 Marine
$639,000
$600,000
6.10%
5
4
0
43
2,172
$276
2,172
$276
4/24/12
811 15th
$750,000
$720,000
4.00%
3
2
2
76
2,058
$350
1,966
$366
2/29/12
1035 10th
$799,000
$725,000
9.26%
6
4
4
93
3,043
$238
3,043
$238
3/30/12
990 Lincoln
$799,000
$764,000
4.38%
4
2
0
15
3,335
$229
2,389
$320
3/29/12
1026 Lincoln
$835,000
$800,000
4.19%
4
3
0
242
2,841
$282
2,561
$312
3/28/12
904 15th
$839,000
$820,000
2.26%
5
4
2
109
2,712
$302
2,642
$310
2/29/12
1139 12th
$868,400
$825,000
5.00%
7
4
0
365
3,898
$212
2,660
$310
4/26/12
766 16th
$995,000
$950,000
4.52%
4
4
3
107
3,402
$279
3,402
$279
3/29/12
842 13th
$1,195,000
$1,100,000
7.95%
3
3
3
312
2,620
$420
2,620
$420

AVERAGES
$738,443
$704,571
4.26%
4
3
1
114
2,431
$301
2,224
$324
Discount = Percentage off of list price; DOM = Days on the Market;  /SF = Price per square foot (total) $/fin = Price per finished square foot
Source: IRES MLS. Information deemed reliable, but not guaranteed.