The weather heated up early this year in Boulder and so
did the real estate market in my home neighborhood -- the greater Flatirons area (University Hill,
Rose Hill, Chautauqua). Spring sales show that the pent-up demand we’ve been
hearing about during the recession is becoming “un-pent.” See table below for
2012 sales through mid-May. Confidence has returned and motivated buyers are
coming out of the woodwork – from CU parents to investors and homebuyers. The
problem is that there are not enough quality homes on the market for them to
buy. In mid-May there were 43 active listings under $2 million in this area, of
which 19 were already under contract!
 |
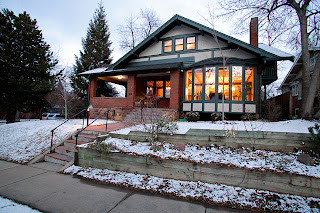
| SOLD! My listing at 990 Lincoln Place went under contract in two weeks. |
Chautauqua, Rose Hill - West of 9th, South of Canyon
|
||||||||||||
Closed
|
Address
|
List Price
|
Sold Price
|
Discount
|
Beds
|
Bath
|
Gar.
|
DOM
|
Total SF
|
$/ SF
|
Fin. SF
|
$/fin
|
3/30/12
|
474 Marine
|
$499,000
|
$450,000
|
9.82%
|
2
|
2
|
1
|
79
|
1,740
|
$259
|
1,200
|
$375
|
4/18/12
|
924 8th
|
$525,000
|
$485,000
|
7.62%
|
2
|
2
|
1
|
170
|
1,121
|
$433
|
1,121
|
$433
|
4/6/12
|
623 Marine
|
$585,000
|
$551,400
|
5.74%
|
3
|
3
|
2
|
81
|
2,592
|
$213
|
2,592
|
$213
|
4/23/12
|
834 7th
|
$599,000
|
$599,500
|
-0.08%
|
2
|
2
|
2
|
46
|
1,679
|
$357
|
1,492
|
$402
|
1/3/12
|
627 Marine
|
$674,900
|
$640,000
|
5.17%
|
3
|
2
|
2
|
100
|
2,110
|
$303
|
1,724
|
$371
|
1/31/12
|
835 Grant
|
$849,000
|
$774,553
|
8.77%
|
4
|
3
|
0
|
185
|
3,284
|
$236
|
3,100
|
$250
|
3/20/12
|
470 College
|
$1,295,000
|
$1,220,000
|
5.79%
|
5
|
3
|
0
|
75
|
2,916
|
$418
|
2,750
|
$444
|
3/30/12
|
445 Christmas Tr.
|
AUCTION
|
$1,650,000
|
0.00%
|
4
|
4
|
2
|
51
|
5,804
|
$284
|
5,804
|
$284
|
3/30/12
|
900 6th
|
$1,975,000
|
$1,980,000
|
-0.25%
|
4
|
3
|
2
|
54
|
3,360
|
$589
|
3,360
|
$589
|
AVERAGES
|
$875,238
|
$927,828
|
4.73%
|
3
|
3
|
1
|
93
|
2,734
|
$344
|
2,571
|
$373
|
|
The Hill - East of 9th, between Canyon and Baseline
|
||||||||||||
5/3/12
|
965 10th
|
$405,000
|
$385,000
|
4.94%
|
3
|
2
|
1
|
109
|
1,406
|
$274
|
1,406
|
$274
|
2/17/12
|
896 17th
|
$499,900
|
$485,000
|
2.98%
|
3
|
2
|
0
|
19
|
1,849
|
$262
|
1,849
|
$262
|
5/11/12
|
833 Lincoln
|
$549,000
|
$550,000
|
-0.18%
|
3
|
2
|
1
|
32
|
1,508
|
$365
|
1,248
|
$441
|
4/12/12
|
1260 Cascade
|
$589,900
|
$565,000
|
4.22%
|
3
|
2
|
2
|
58
|
1,359
|
$416
|
1,359
|
$416
|
1/26/12
|
1315 9th
|
$575,000
|
$575,000
|
0.00%
|
4
|
2
|
2
|
12
|
1,824
|
$315
|
1,824
|
$315
|
3/30/12
|
932 Marine
|
$639,000
|
$600,000
|
6.10%
|
5
|
4
|
0
|
43
|
2,172
|
$276
|
2,172
|
$276
|
4/24/12
|
811 15th
|
$750,000
|
$720,000
|
4.00%
|
3
|
2
|
2
|
76
|
2,058
|
$350
|
1,966
|
$366
|
2/29/12
|
1035 10th
|
$799,000
|
$725,000
|
9.26%
|
6
|
4
|
4
|
93
|
3,043
|
$238
|
3,043
|
$238
|
3/30/12
|
990 Lincoln
|
$799,000
|
$764,000
|
4.38%
|
4
|
2
|
0
|
15
|
3,335
|
$229
|
2,389
|
$320
|
3/29/12
|
1026 Lincoln
|
$835,000
|
$800,000
|
4.19%
|
4
|
3
|
0
|
242
|
2,841
|
$282
|
2,561
|
$312
|
3/28/12
|
904 15th
|
$839,000
|
$820,000
|
2.26%
|
5
|
4
|
2
|
109
|
2,712
|
$302
|
2,642
|
$310
|
2/29/12
|
1139 12th
|
$868,400
|
$825,000
|
5.00%
|
7
|
4
|
0
|
365
|
3,898
|
$212
|
2,660
|
$310
|
4/26/12
|
766 16th
|
$995,000
|
$950,000
|
4.52%
|
4
|
4
|
3
|
107
|
3,402
|
$279
|
3,402
|
$279
|
3/29/12
|
842 13th
|
$1,195,000
|
$1,100,000
|
7.95%
|
3
|
3
|
3
|
312
|
2,620
|
$420
|
2,620
|
$420
|
AVERAGES
|
$738,443
|
$704,571
|
4.26%
|
4
|
3
|
1
|
114
|
2,431
|
$301
|
2,224
|
$324
|
|
Discount = Percentage off of list price; DOM = Days
on the Market; /SF = Price per
square foot (total) $/fin = Price per finished square foot
Source: IRES MLS. Information
deemed reliable, but not guaranteed.

No comments:
Post a Comment